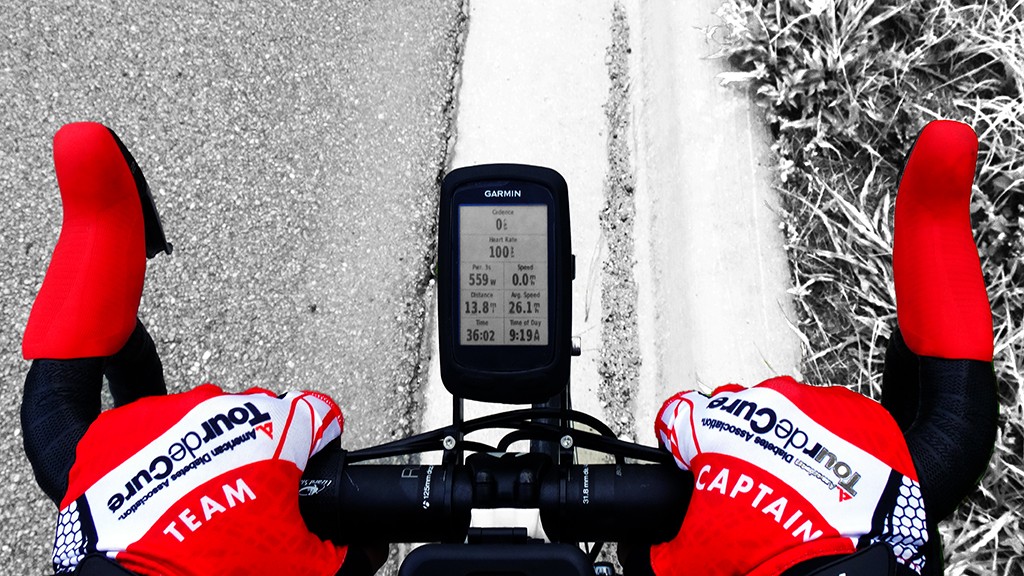
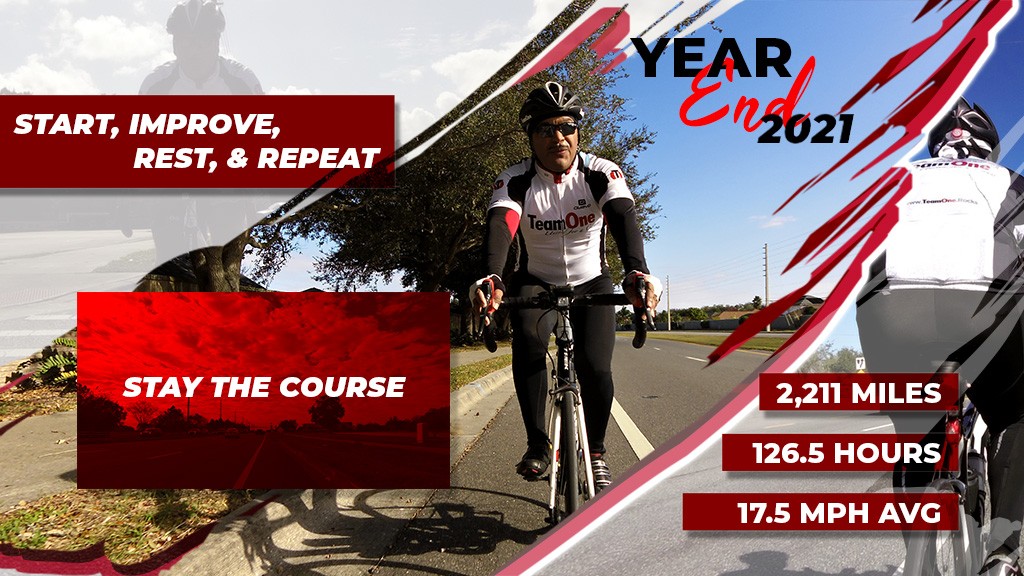
It is January 1, 2022, here I sit in Starbucks like every other year reflecting on all that I have accomplished. During the 2021 post-pandemic, I have completed 2,211 miles, participated in 2 charity events, over 23 hours of camaraderie with teammates, and over 103 hours of solo rides. I originally had my goal for 2021 as 3,500 miles but quickly found out that was not going to be attainable 4 months into the year, so I decreased it to 2,000 miles. I barely made it!

Also, don’t forget to view My Year Cycling Video Story (0:45 mins).
Statistics
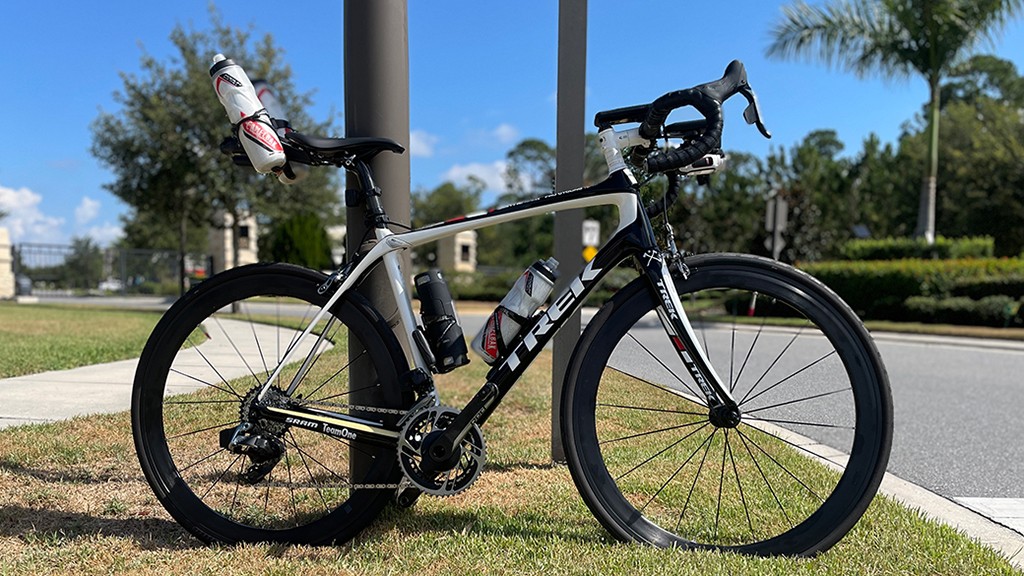
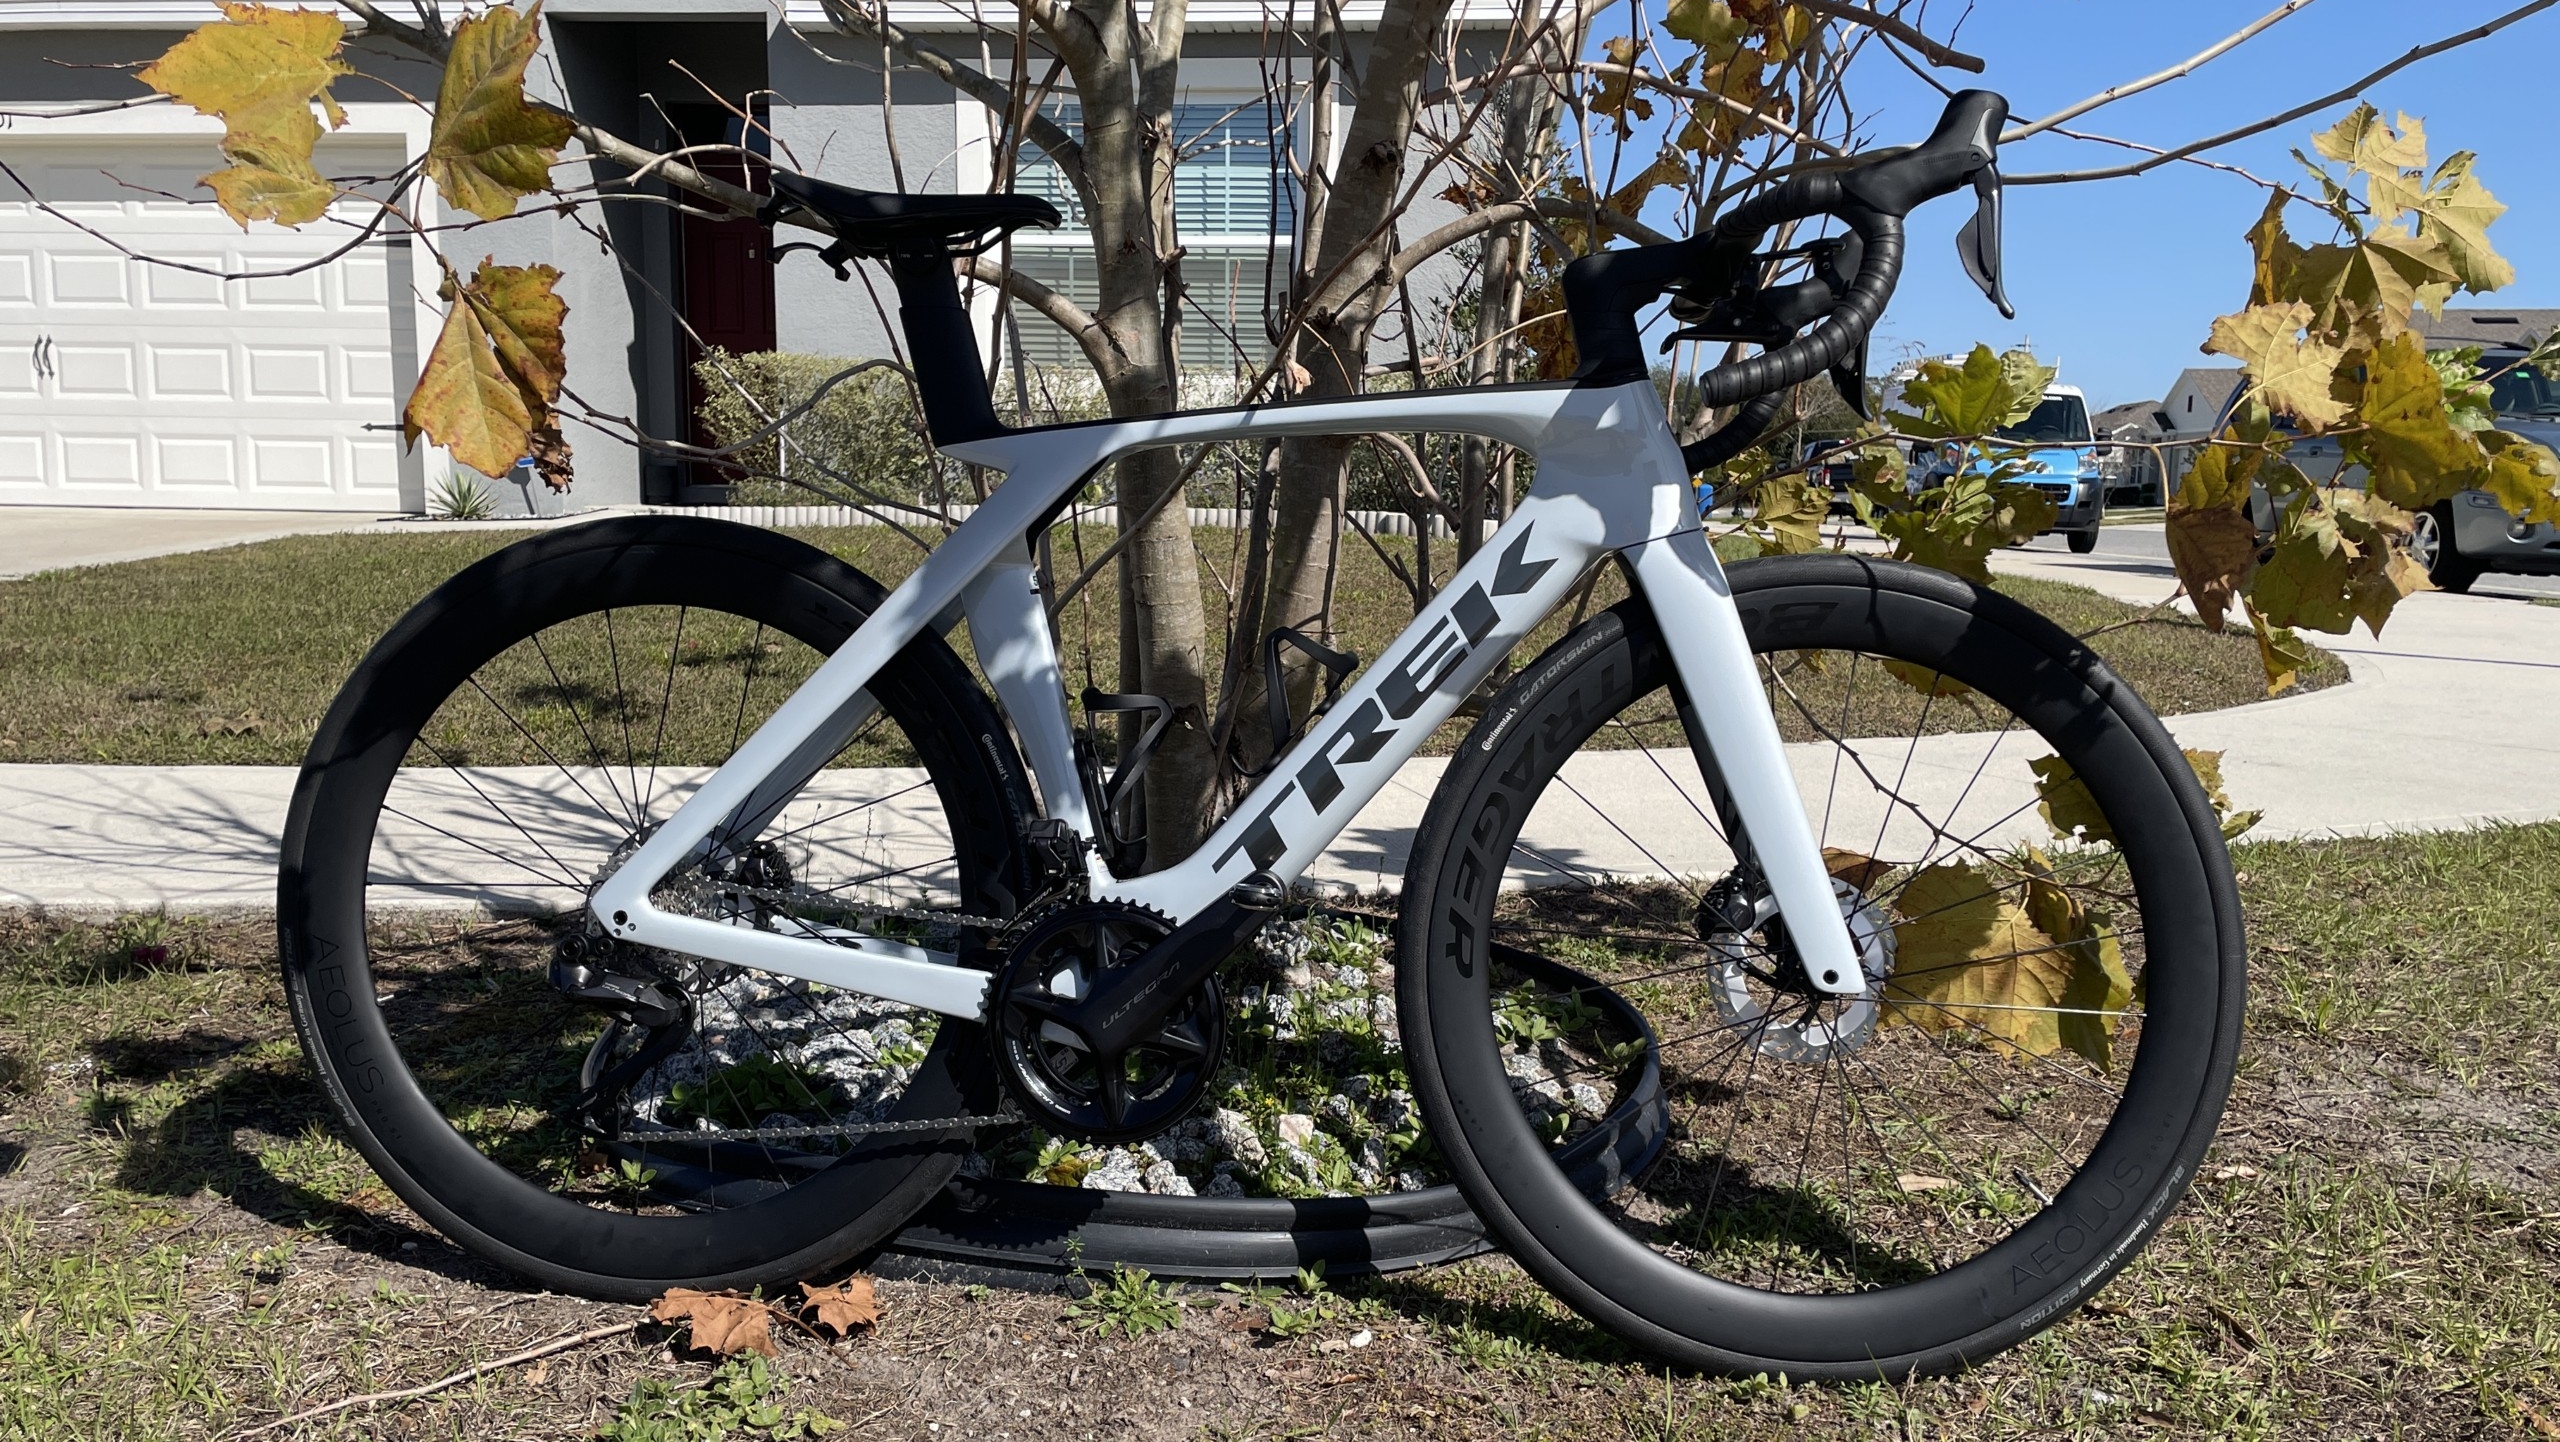
Since 2014 the bike I ride is called “The Beast”, it is a Trek Domane 6.9, Bontrager Team edition (Specs). Prior to my Domane, I rode a bike I called “Ninja” a 2007 Specialized, Transition Elite TT (Specs).
| YEARLY (Updated: January 5, 2022) | |||||
|---|---|---|---|---|---|
| Item | 2021 | 2020 | 2019 | Average | Totals |
| Total Rides | 80 | 93 | 55 | 76 | 228 |
| Total Distance in Miles | 2,211 | 3,003 | 1,203 | 2,139 | 6,418 |
| It’s Like Riding From New York City To (approx.) | Salt Lake City, UT (1,967) | Rapid City, UT (1,504 x2) | Baton Rouge, LA (1,193) | Kansas City, MS (1,096 x2 ) | Cheyenne, WY (1,604 x4) |
| How much of the Earth’s Circumference (24,901 mi) | 8.88% | 12.06% | 4.83% | 8.59% | 25.77% |
| Total Riding Time (days:hours:mins) | 5:15:09 | 7:08:50 | 2:54:52 | 5:06:15 | 15:18:46 |
| Total Riding Time in Hours (Distance/Avg speed) | 126.29 | 169.95 | 59.56 | 122.00 | 366.00 |
| An Average of How Much of My Life I Ride | 2.30% | 3.11% | 1.25% | 2.12% | 6.70% |
| Total Elevation in Miles (mi) | 1.88 | 2.35 | 1.08 | 1.77 | 5.32 |
| It’s like climbing Mont Blanc (2.99 mi) x times. The highest peak in Europe | 0.63 | 0.79 | 0.36 | 0.59 | 1.78 |
| Avg Speed Miles per Hour (mph) | 17.5 | 17.7 | 17.2 | 17.5 | N/A |
| Avg Max Speed | 22.7 | 22.9 | 27.4 | 22.7 | N/A |
| Avg HR | 143 | 140 | 145 | 143 | N/A |
| Max HR | 240 | 240 | 240 | 240 | N/A |
| Avg Power | 181 | 176 | 188 | 182 | N/A |
| Max Power | 318 | 261 | 199 | 259 | N/A |
| Calories | 83,008 | 106,493 | 46,987 | 78,829 | 236,488 |
| Avg Calories | 1,038 | 1,145 | 854 | 1,012 | 3,037 |
| Avg Temp | 71 | 71 | 66 | 68 | N/A |
| MONTHLY | |||||
|---|---|---|---|---|---|
| Item | 2021 | 2020 | 2019 | Average | Totals |
| Rides | 6.7 | 7.8 | 4.6 | 6.3 | 19.1 |
| Average Miles | 184.3 | 250.3 | 100.3 | 178.3 | 534.8 |
| Average Time in Minutes | 87.6 | 88.4 | 86.2 | 87.4 | 262.1 |
| Average Elevation (ft) | 829.1 | 1,035.5 | 476.6 | 780.4 | 2341.2 |
| PER RIDE | |||||
|---|---|---|---|---|---|
| Item | 2021 | 2020 | 2019 | Average | Totals |
| Average Miles | 27.6 | 32.3 | 21.9 | 27.3 | 81.8 |
| Average Time in Hours | 1.6 | 1.8 | 1.3 | 1.6 | 4.7 |
| Average Elevation (ft) | 124.4 | 133.6 | 104.0 | 120.7 | 362.0 |
| Average Miles per Hour (mph) | 17.5 | 18.0 | 17.2 | 17.5 | N/A |
If you would like more statistics dating back to 2014 view the Ride Statistics (Update: Jan 5, 2022).
Ciao,
Z | TeamOne