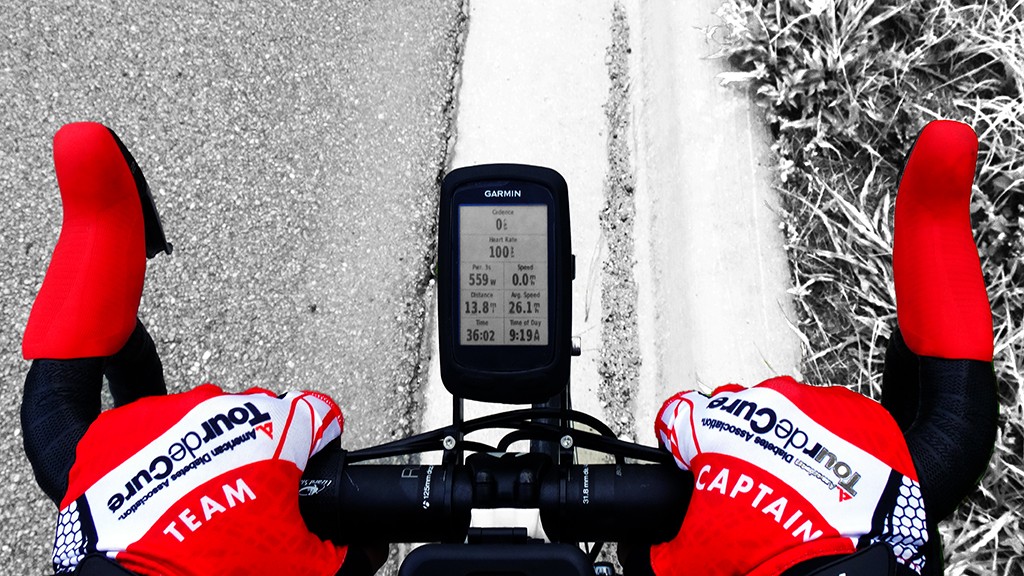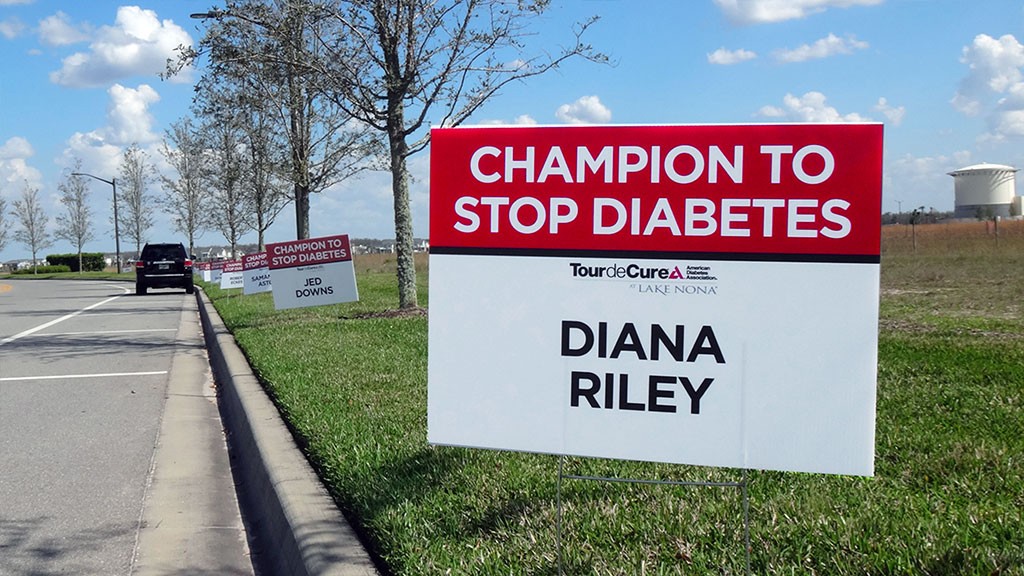
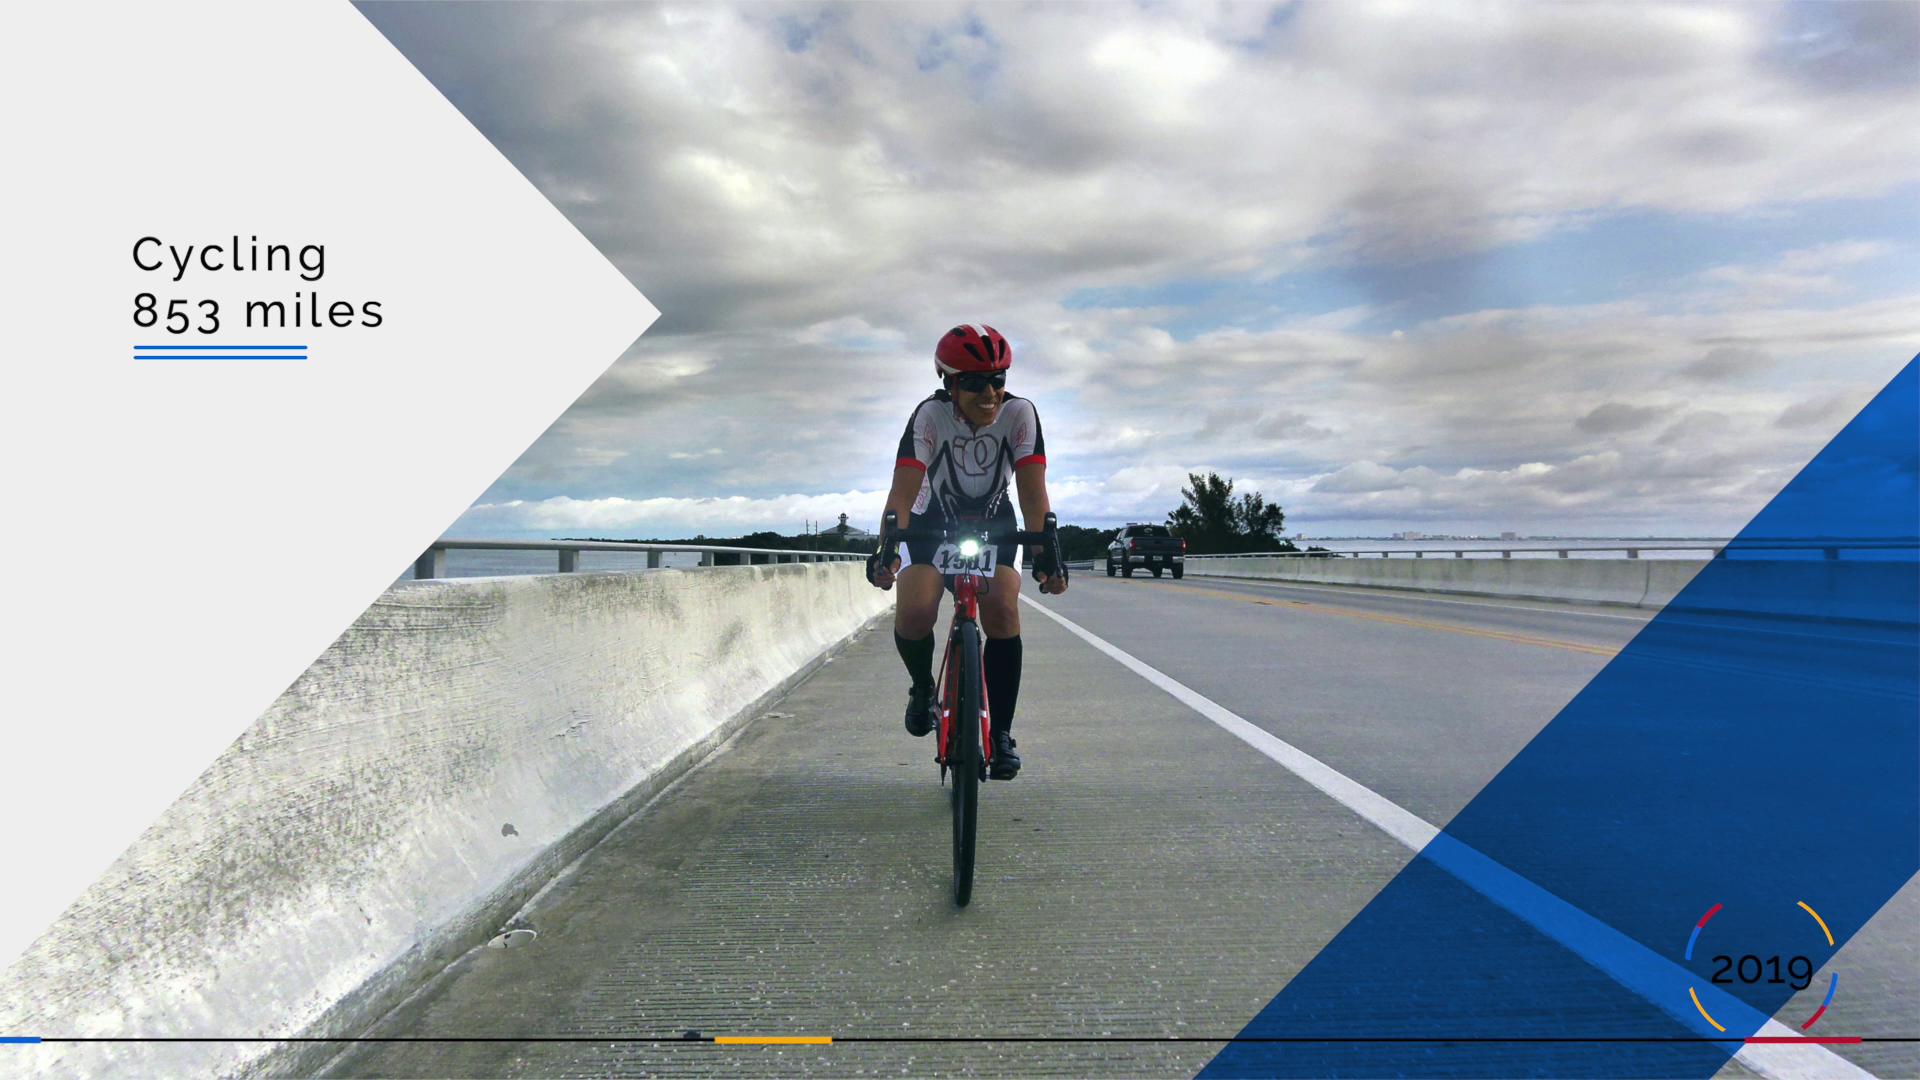
I am 2 days into 2020 and just thinking about the 853 miles on the bike, 5 charity events, and fellowship I have participated in 2019. Here are some numbers for you to view. I’m very surprised that I was able to log as many miles as possible this year because of how busy this year has been. I’m on track to have a bigger year in 2020.
Also, don’t forget to view My Year Cycling Video Story.
Statistics
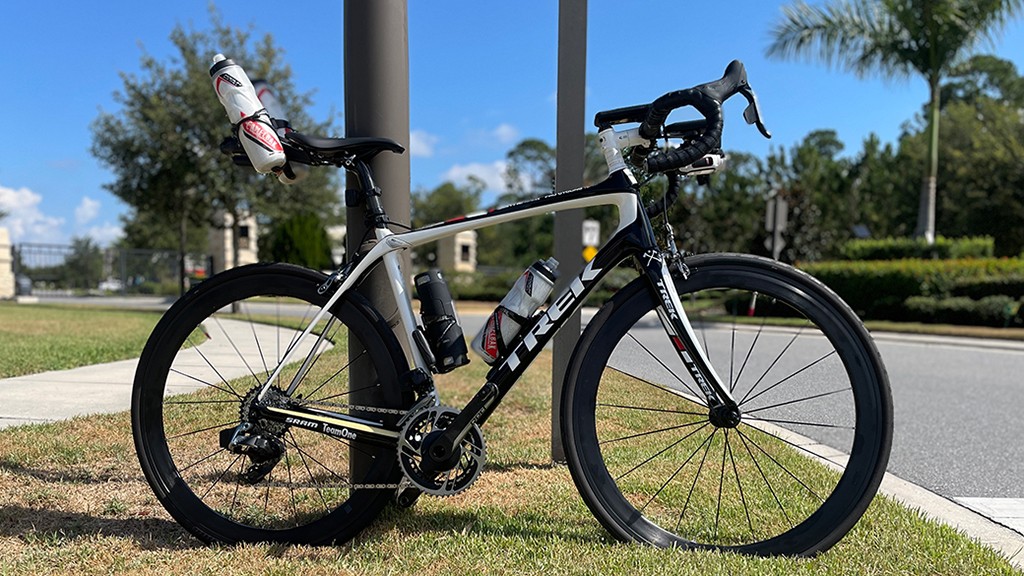
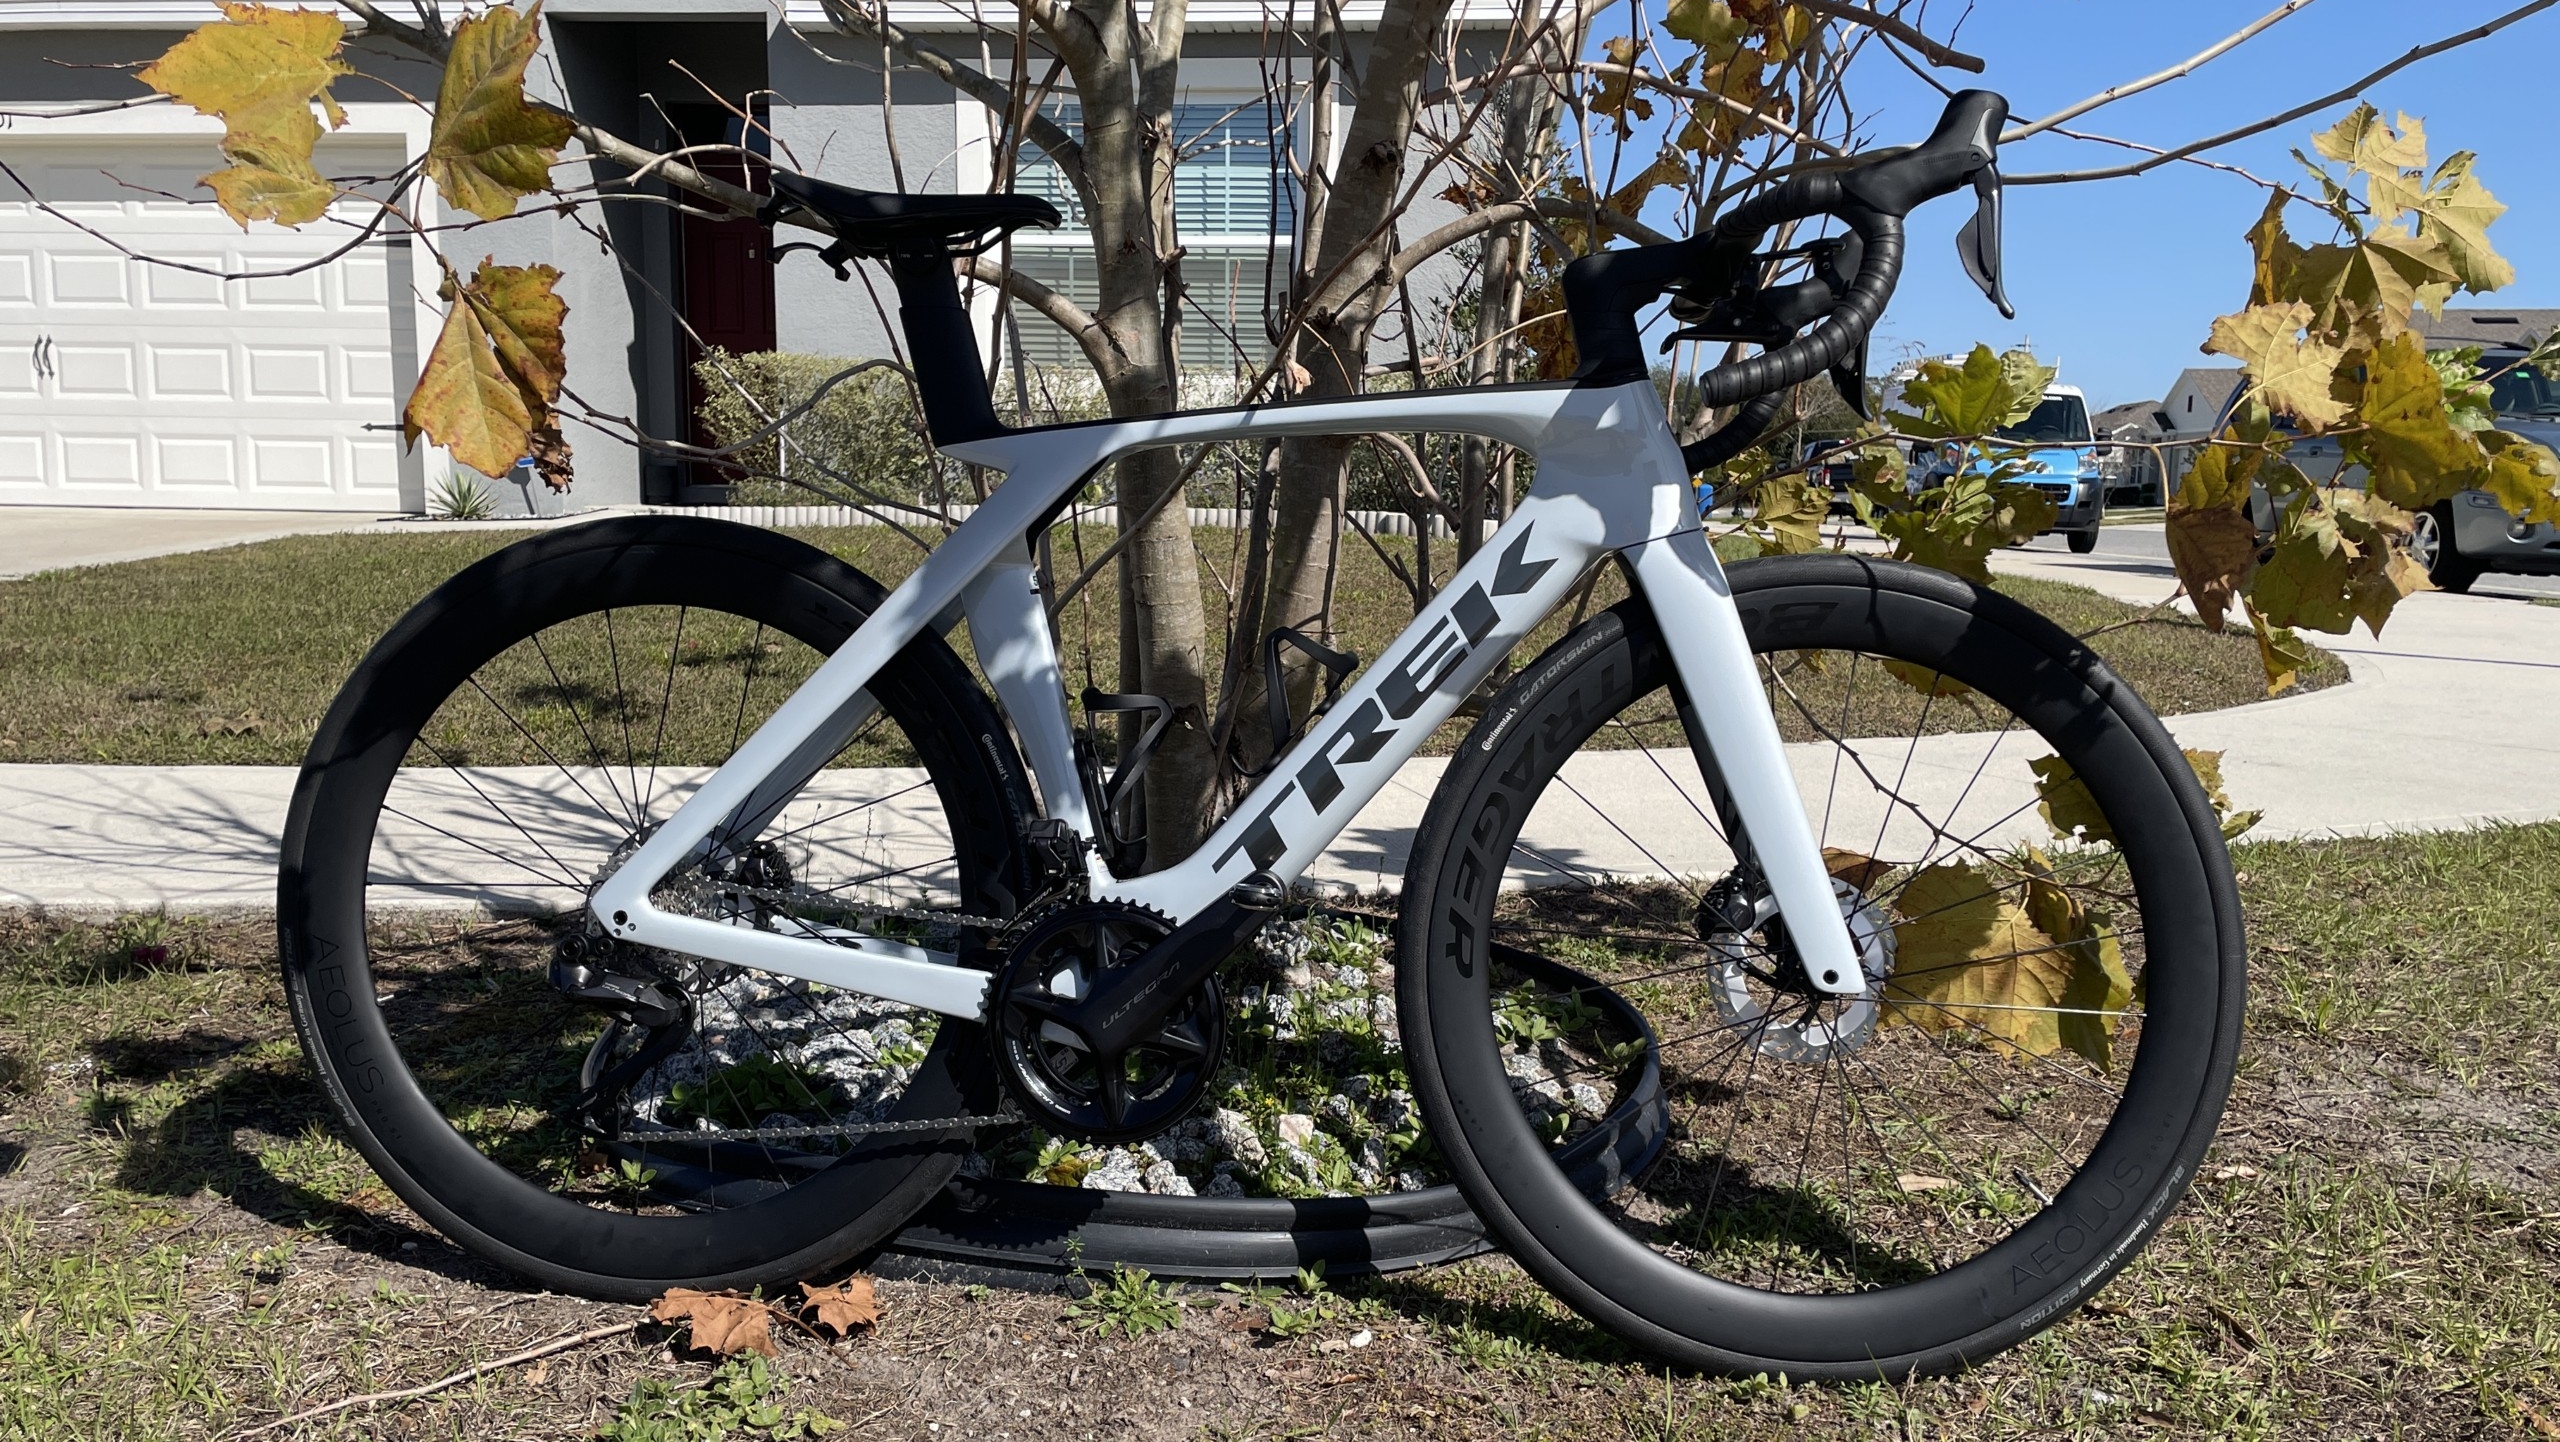
The bike I ride is called “Cyborg”, it is a Trek Domane SL6 ( Specs).
| YEARLY | |||||
|---|---|---|---|---|---|
| Item | 2020 | 2019 | 2018 | Average | Totals |
| Total Rides | 2 | 37 | 86 | 42 | 125 |
| Total Distance in Miles | 40 | 853 | 1,941 | 944 | 2,833 |
| It’s Like Riding From New York City To (approx.) | Lakewood, NJ (42) | Jacksonville, FL (834) | Salt Lake City, UT (1,972) | Columbia, MS (980) | Houston, TX (1,419 x2) |
| How much of the Earth’s Circumference (24,901 mi) | 0.16% | 3.42% | 7.79% | 3.80% | 11.40% |
| Total Riding Time (day:hours:min) | 0:02:07 | 2:01:10 | 4:17:03 | 2:06:47 | 6:20:21 |
| Total Riding Time in Hours (Distance/Avg speed) | 2.12 | 49.07 | 117.62 | 56.27 | 168.81 |
| An Average of How Much of My Life I Ride | 0.04% | 0.88% | 2.01% | 0.98% | 2.94% |
| Total Elevation in Miles (mi) | 0.04 | 0.80 | 1.63 | 0.82 | 2.47 |
| It’s like climbing Mont Blanc (2.99 mi) x times. The highest peak in Europe | 0.01 | 0.27 | 0.55 | 0.28 | 0.83 |
| Avg Speed Miles per Hour (mph) | 19.0 | 17.4 | 16.5 | 17.6 | N/A |
| Avg Max Speed | 23.2 | 22.3 | 21.7 | 22.4 | N/A |
| Avg HR | 152 | 141 | 139 | 144 | N/A |
| Max HR | 164 | 169 | 160 | 164 | N/A |
| Avg Power | 202 | 121 | 148 | 157 | N/A |
| Max Power | 209 | 161 | 185 | 185 | N/A |
| Calories | 1,526 | 20,657 | 59,817 | 27,333 | 82,000 |
| Avg Calories | 763 | 590 | 757 | 703 | 2,110 |
| Avg Temp | 70 | 69 | 71 | 70 | N/A |
| MONTHLY | |||||
|---|---|---|---|---|---|
| Item | 2020 | 2019 | 2018 | Average | Totals |
| Rides | 0.2 | 3.1 | 7.2 | 3 | 10 |
| Average Miles | 3.4 | 71.1 | 161.7 | 79 | 236 |
| Average Time in Minutes | 94.8 | 86.9 | 82.5 | 3 | 9 |
| Average Elevation (ft) | 16 | 352 | 719 | 362 | 1,087 |
| PER RIDE | |||||
|---|---|---|---|---|---|
| Item | 2020 | 2019 | 2018 | Average | Totals |
| Average Miles | 20.1 | 23 | 22.6 | 21.9 | 65.7 |
| Average Time in Hours | 1.1 | 1.3 | 1.4 | 1.3 | 3.8 |
| Average Elevation (ft) | 98.5 | 114.2 | 100.3 | 104.3 | 313 |
| Average Miles per Hour (mph) | 19.0 | 17.4 | 16.5 | 17.6 | N/A |
Ciao,
Catherine | TeamOne