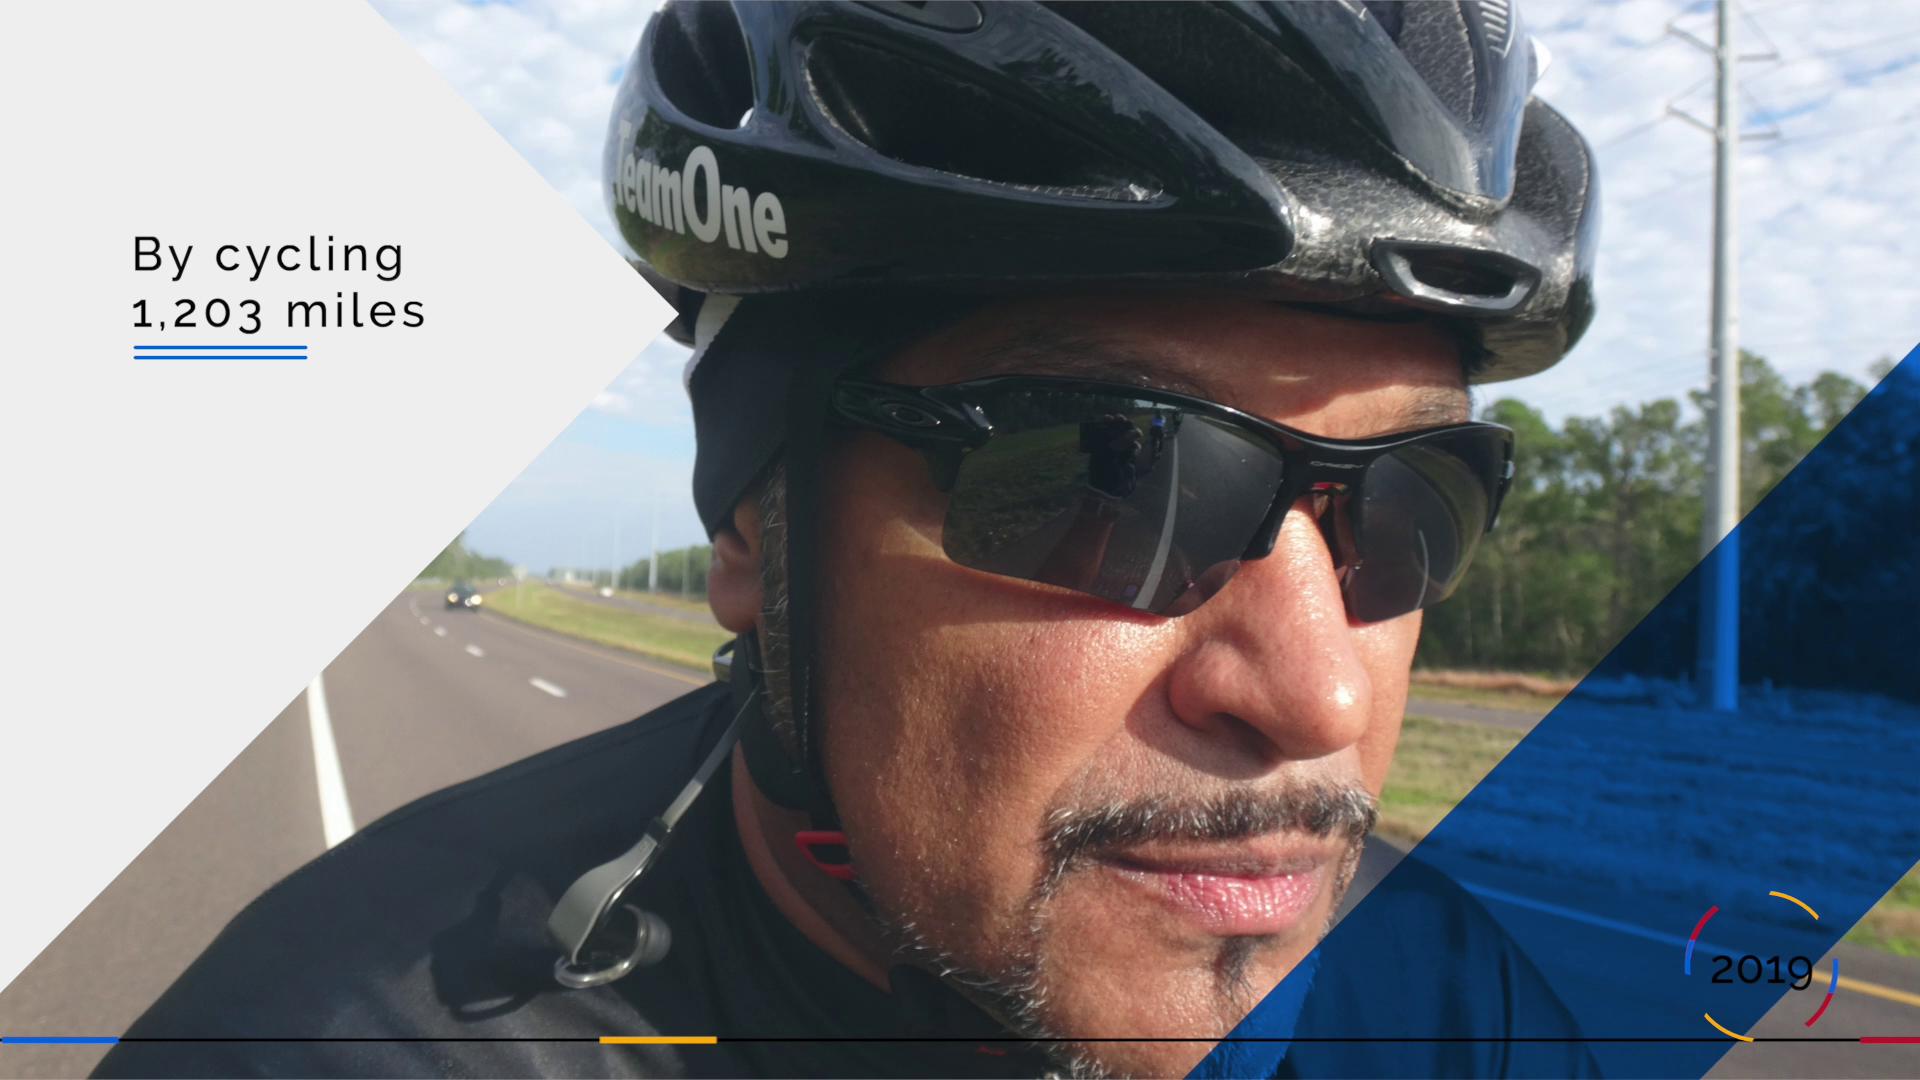
It is January 3, 2020, here I sit in Starbucks reflecting on all the 1,203 miles I covered, 5 charity events, and over 55 hours of camaraderie with teammates I have participated in 2019. I originally had my goal for 2019 as 2,500 miles but quickly found out that was not going to be attainable so I drop it to 1,200 miles. I barely made it! Also, don’t forget to view My Year Cycling Video Story.
I’m on track to have a bigger year in 2020 by planning to participate in Prospera Tour Latino (Feb), TdC at Lake Nona (Mar), Cross Florida (XFL) Ride (Apr), Ben to the Shore Tour (Jul), Six Gap Century (Sep), Horrible Hundred (Nov), JHOP 100 Century (Nov), and Riding with Santa Toy Ride (Dec). Below are my previous three years worth of statistics for your review.
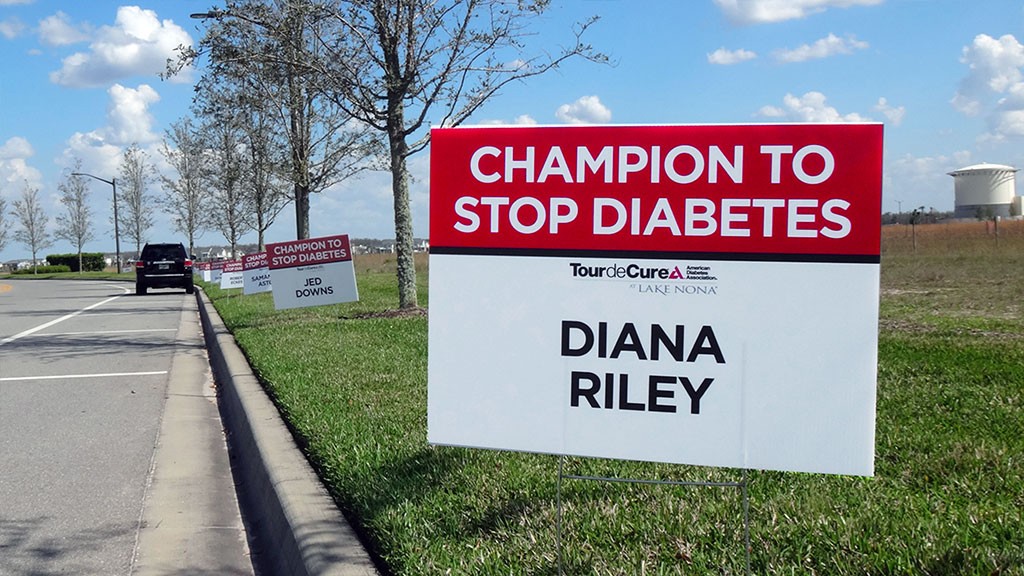
SUPPORT TeamOne: Help Us Fight Diabetes
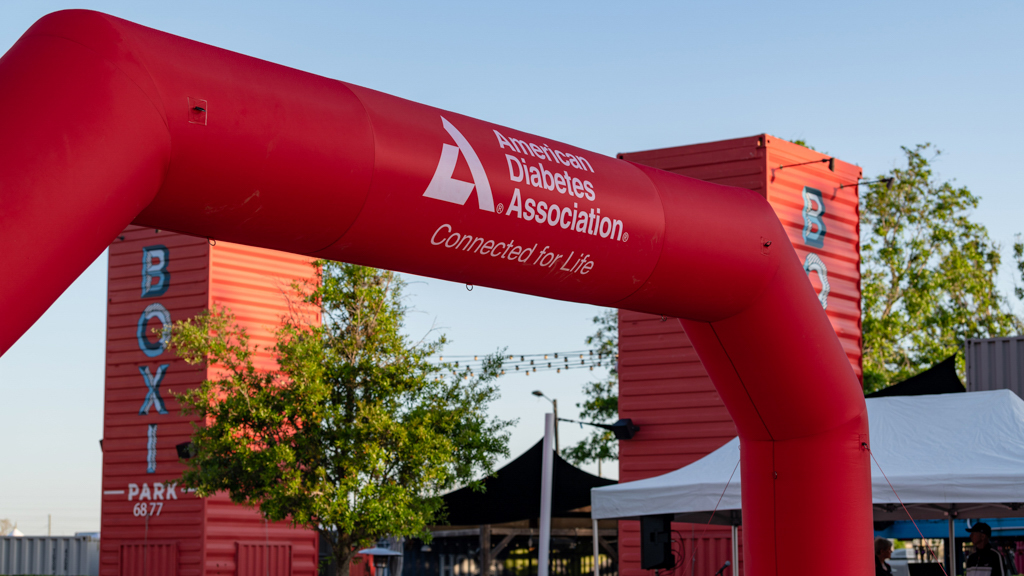
 Our team is supporting the American Diabetes Association because we want to make a difference. We want to lead. We want to inspire. We want to empower!
4 Ways to Help - Join the Team, Donate, Volunteer, Socialize by Telling Friends and Family Members - https://tour-diabetes.donordrive.com/participant/z
Donate Now!
Statistics
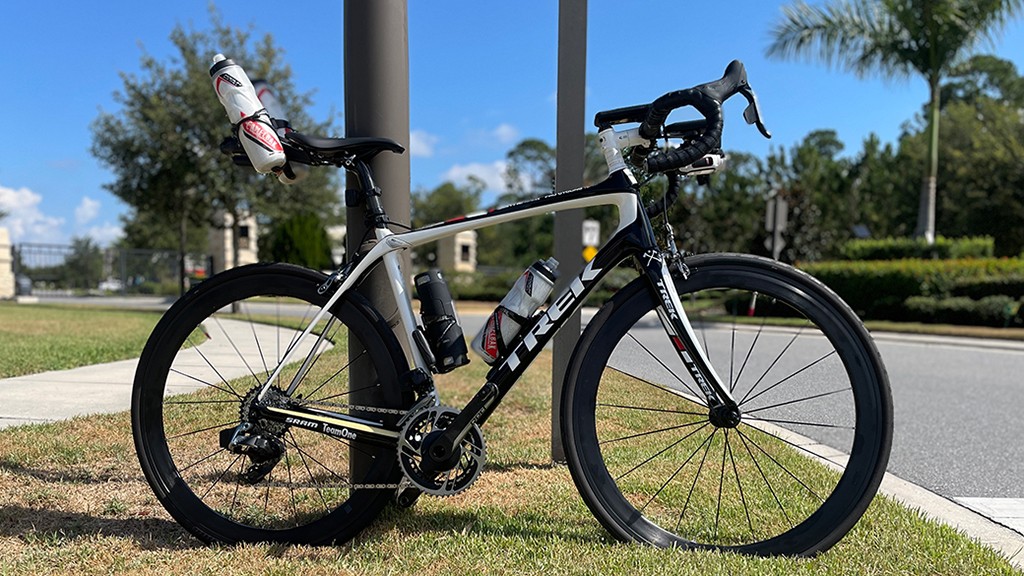
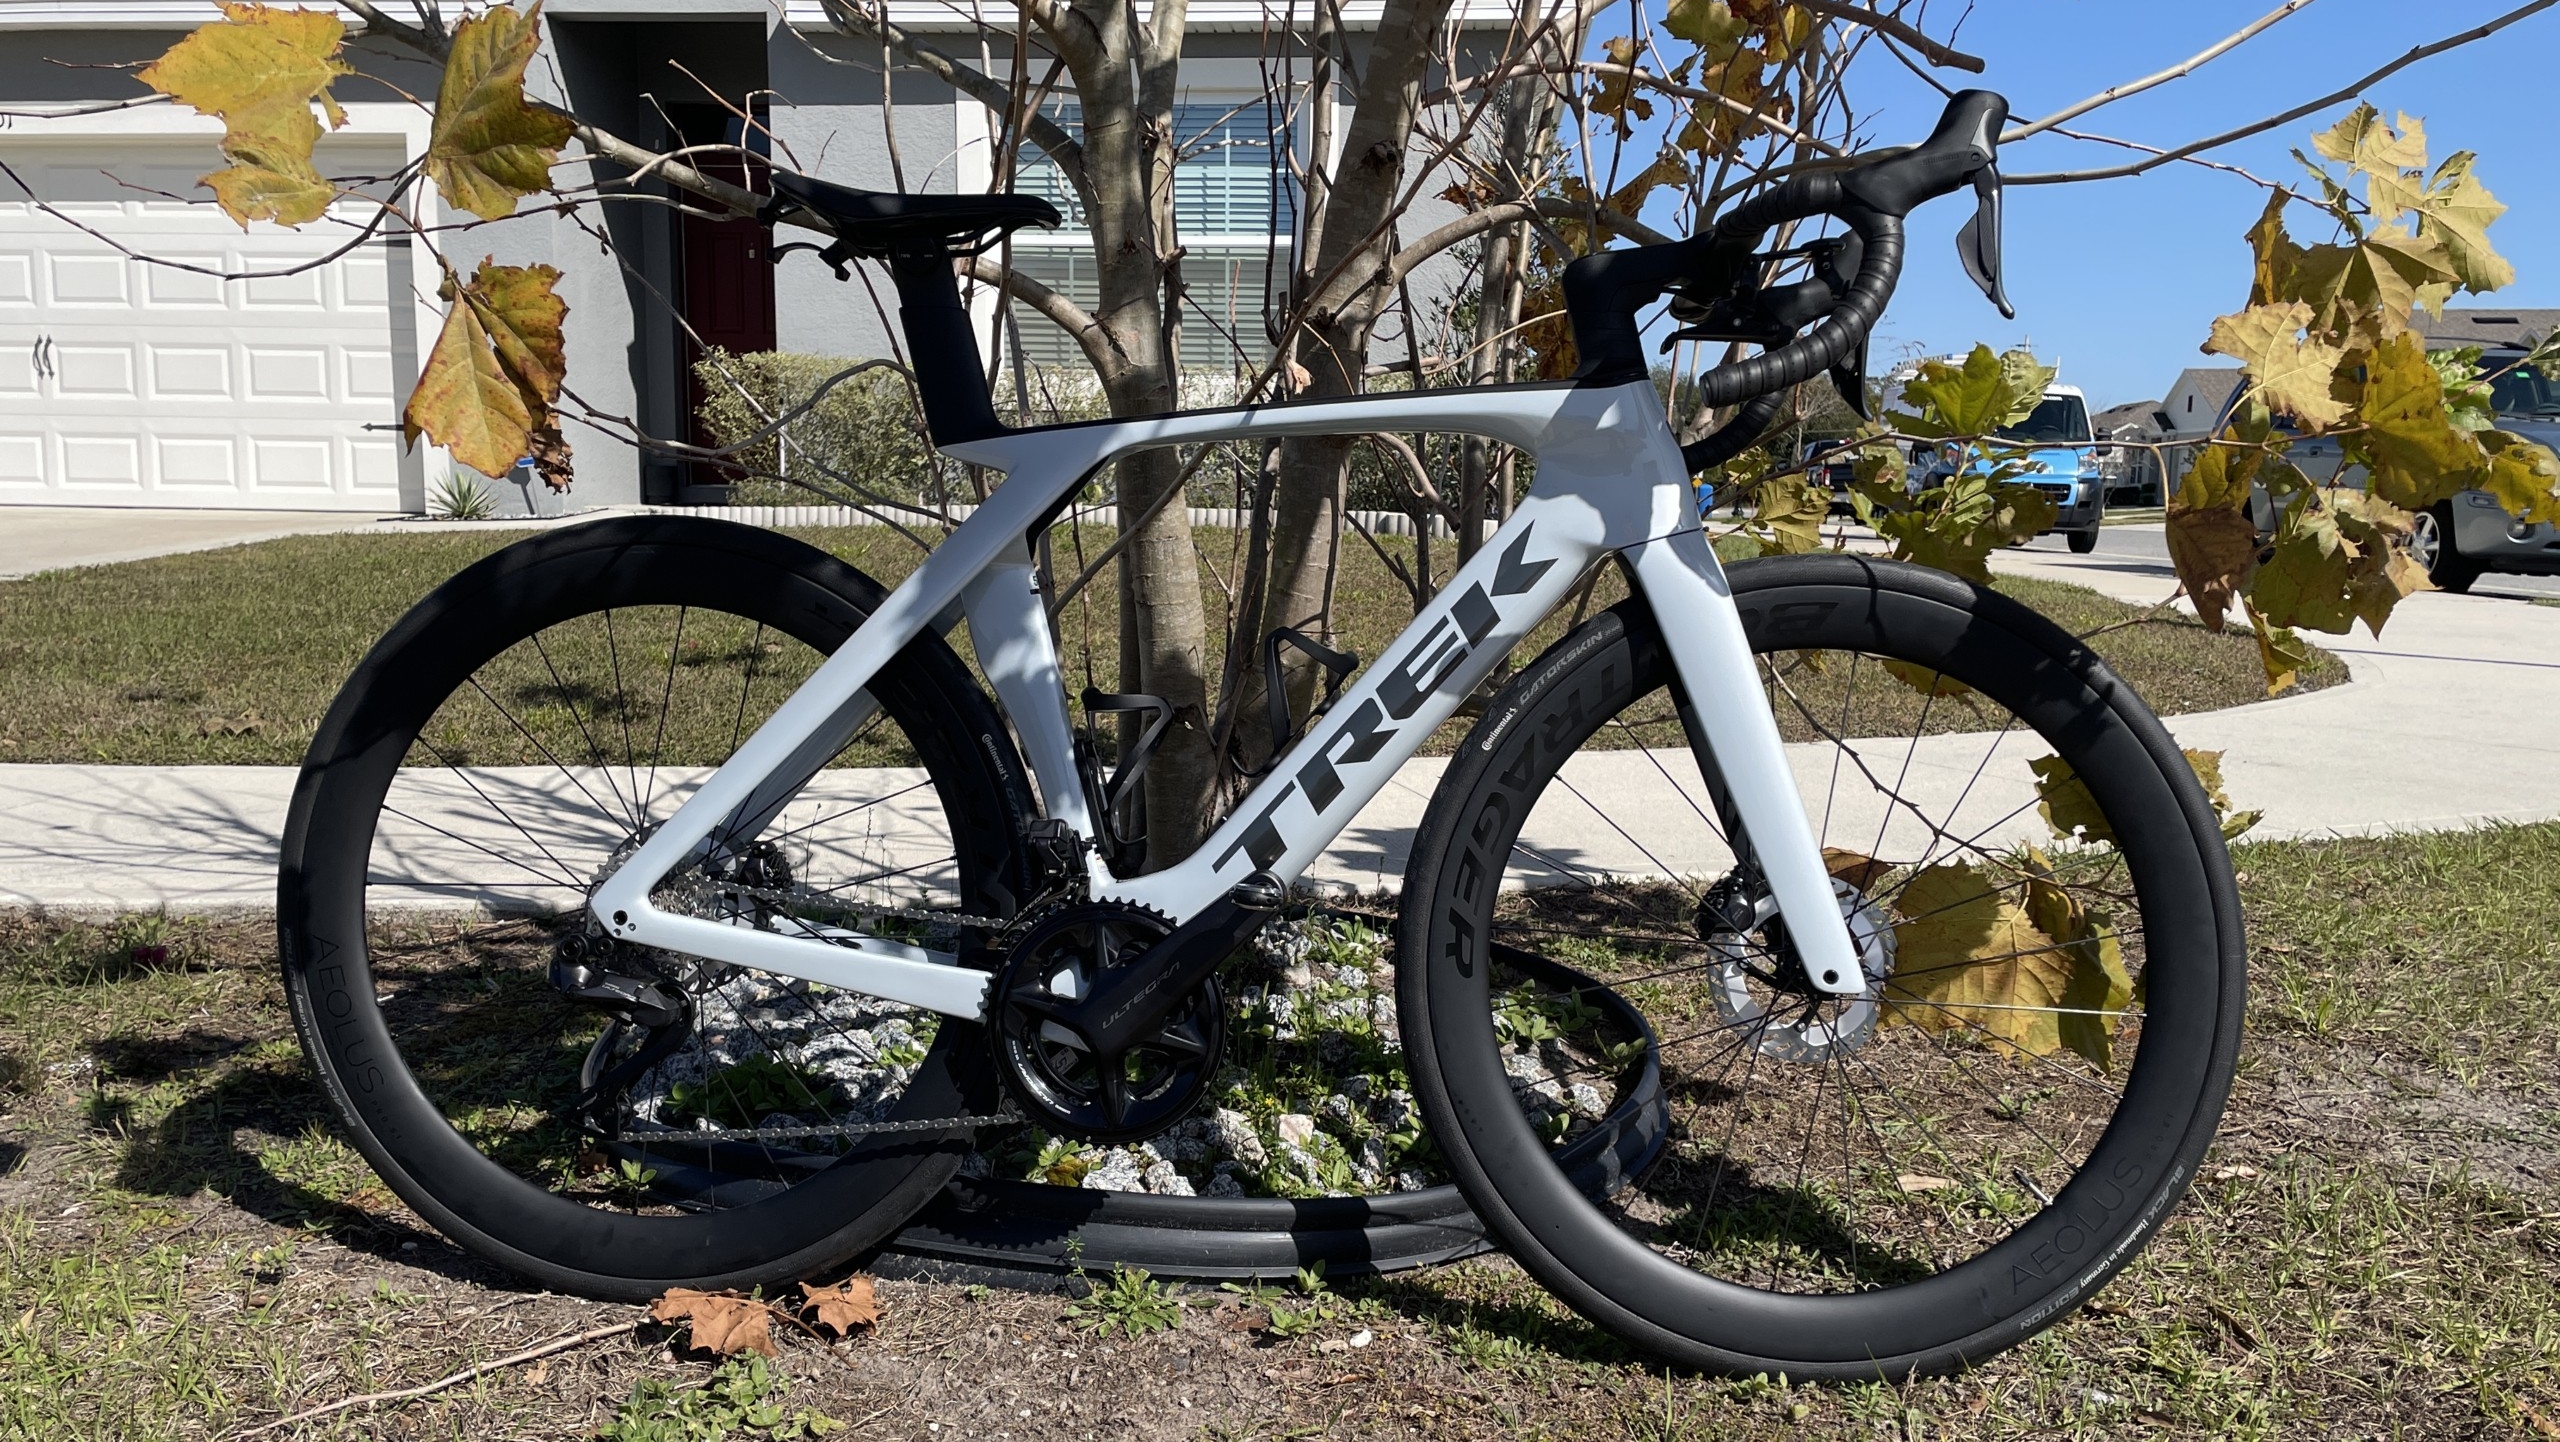
Since 2014 the bike I ride is called “The Beast”, it is a Trek Domane 6.9, Bontrager Team edition ( Specs). Prior to my Domane I rode a bike I called “Ninja” a 2007 Specialized, Transition Elite TT ( Specs).
| YEARLY (Update: Feb 10, 2020) | |||||
|---|---|---|---|---|---|
| Item | 2020 | 2019 | 2018 | Average | Totals |
| Total Rides | 10 | 55 | 69 | 44 | 134 |
| Total Distance in Miles | 316 | 1,203 | 1,959 | 1,159 | 3,478 |
| It’s Like Riding From New York City To (approx.) |
Pittsburg, PA (315) | Baton Rouge, LA (1,193) | Salt Lake City, UT (1,967) | Topeka, Ks (1,154) | Denver, CO (1,631 x2) |
| How much of the Earth’s Circumference (24,901 mi) | 1.27% | 4.83% | 7.87% | 4.66% | 13.97% |
| Total Riding Time (day:hours:min) | 0:47:34 | 2:54:52 | 4:42:10 | 2:48:12 | 8:24:36 |
| Total Riding Time in Hours (Distance/Avg speed) |
16.30 | 59.56 | 69.96 | 48.61 | 145.83 |
| An Average of How Much of My Life I Ride | 0.33% | 1.25% | 2.03% | 1.20% | 3.60% |
| Total Elevation in Miles (mi) | 0.48 | 1.08 | 2.49 | 1.35 | 4.05 |
| It’s like climbing Mont Blanc (2.99 mi) x times. The highest peak in Europe |
0.16 | 0.36 | 0.83 | 0.45 | 1.36 |
| Avg Speed Miles per Hour (mph) |
19.4 | 20.2 | 28.0 | 22.5 | N/A |
| Avg Max Speed | 34.6 | 27.7 | 46.0 | 36.1 | N/A |
| Avg HR | 152 | 165 | 167 | 161 | N/A |
| Max HR | 180 | 240 | 240 | 220 | N/A |
| Avg Power | 201 | 239 | 248 | 229 | N/A |
| Max Power | 220 | 270 | 265 | 252 | N/A |
| Calories | 11,611 | 46,987 | 87,040 | 48,546 | 145,638 |
| Avg Calories | 1,161 | 854 | 1,261 | 1,092 | 3,277 |
| Avg Temp | 66 | 66 | 68 | 67 | N/A |
| MONTHLY | |||||
|---|---|---|---|---|---|
| Item | 2020 | 2019 | 2018 | Average | Totals |
| Rides | 0.8 | 4.6 | 5.8 | 3.7 | 11.2 |
| Average Miles | 26.4 | 100.3 | 163.3 | 96.6 | 289.9 |
| Average Time in Minutes | 97.0 | 101.0 | 140.0 | 112.7 | 338.0 |
| Average Elevation (ft) | 209.8 | 476.6 | 1,095.8 | 594.1 | 1782.2 |
| PER RIDE | |||||
|---|---|---|---|---|---|
| Item | 2020 | 2019 | 2018 | Average | Totals |
| Average Miles | 31.6 | 21.9 | 28.4 | 37.3 | 81.9 |
| Average Time in Hours | 1.6 | 1.1 | 1.0 | 1.2 | 3.7 |
| Average Elevation (ft) | 251.8 | 104.0 | 190.6 | 182.1 | 546.4 |
| Average Miles per Hour (mph) | 19.4 | 20.2 | 28.0 | 22.5 | N/A |
If you would like more statistics dating back to 2014 view the Ride Statistics (Update: Feb 10, 2020).
Ciao,
Z | TeamOne